Big Insights for Small Businesses

Affordable data reporting and dashboard solutions for small and tiny businesses.

Data Reporting Solutions

Affordable data reporting and dashboard solutions tailored for small and tiny businesses to enhance decisions.

Excel Reports

Transform your data into insightful Excel reports that drive better business decisions for your company.
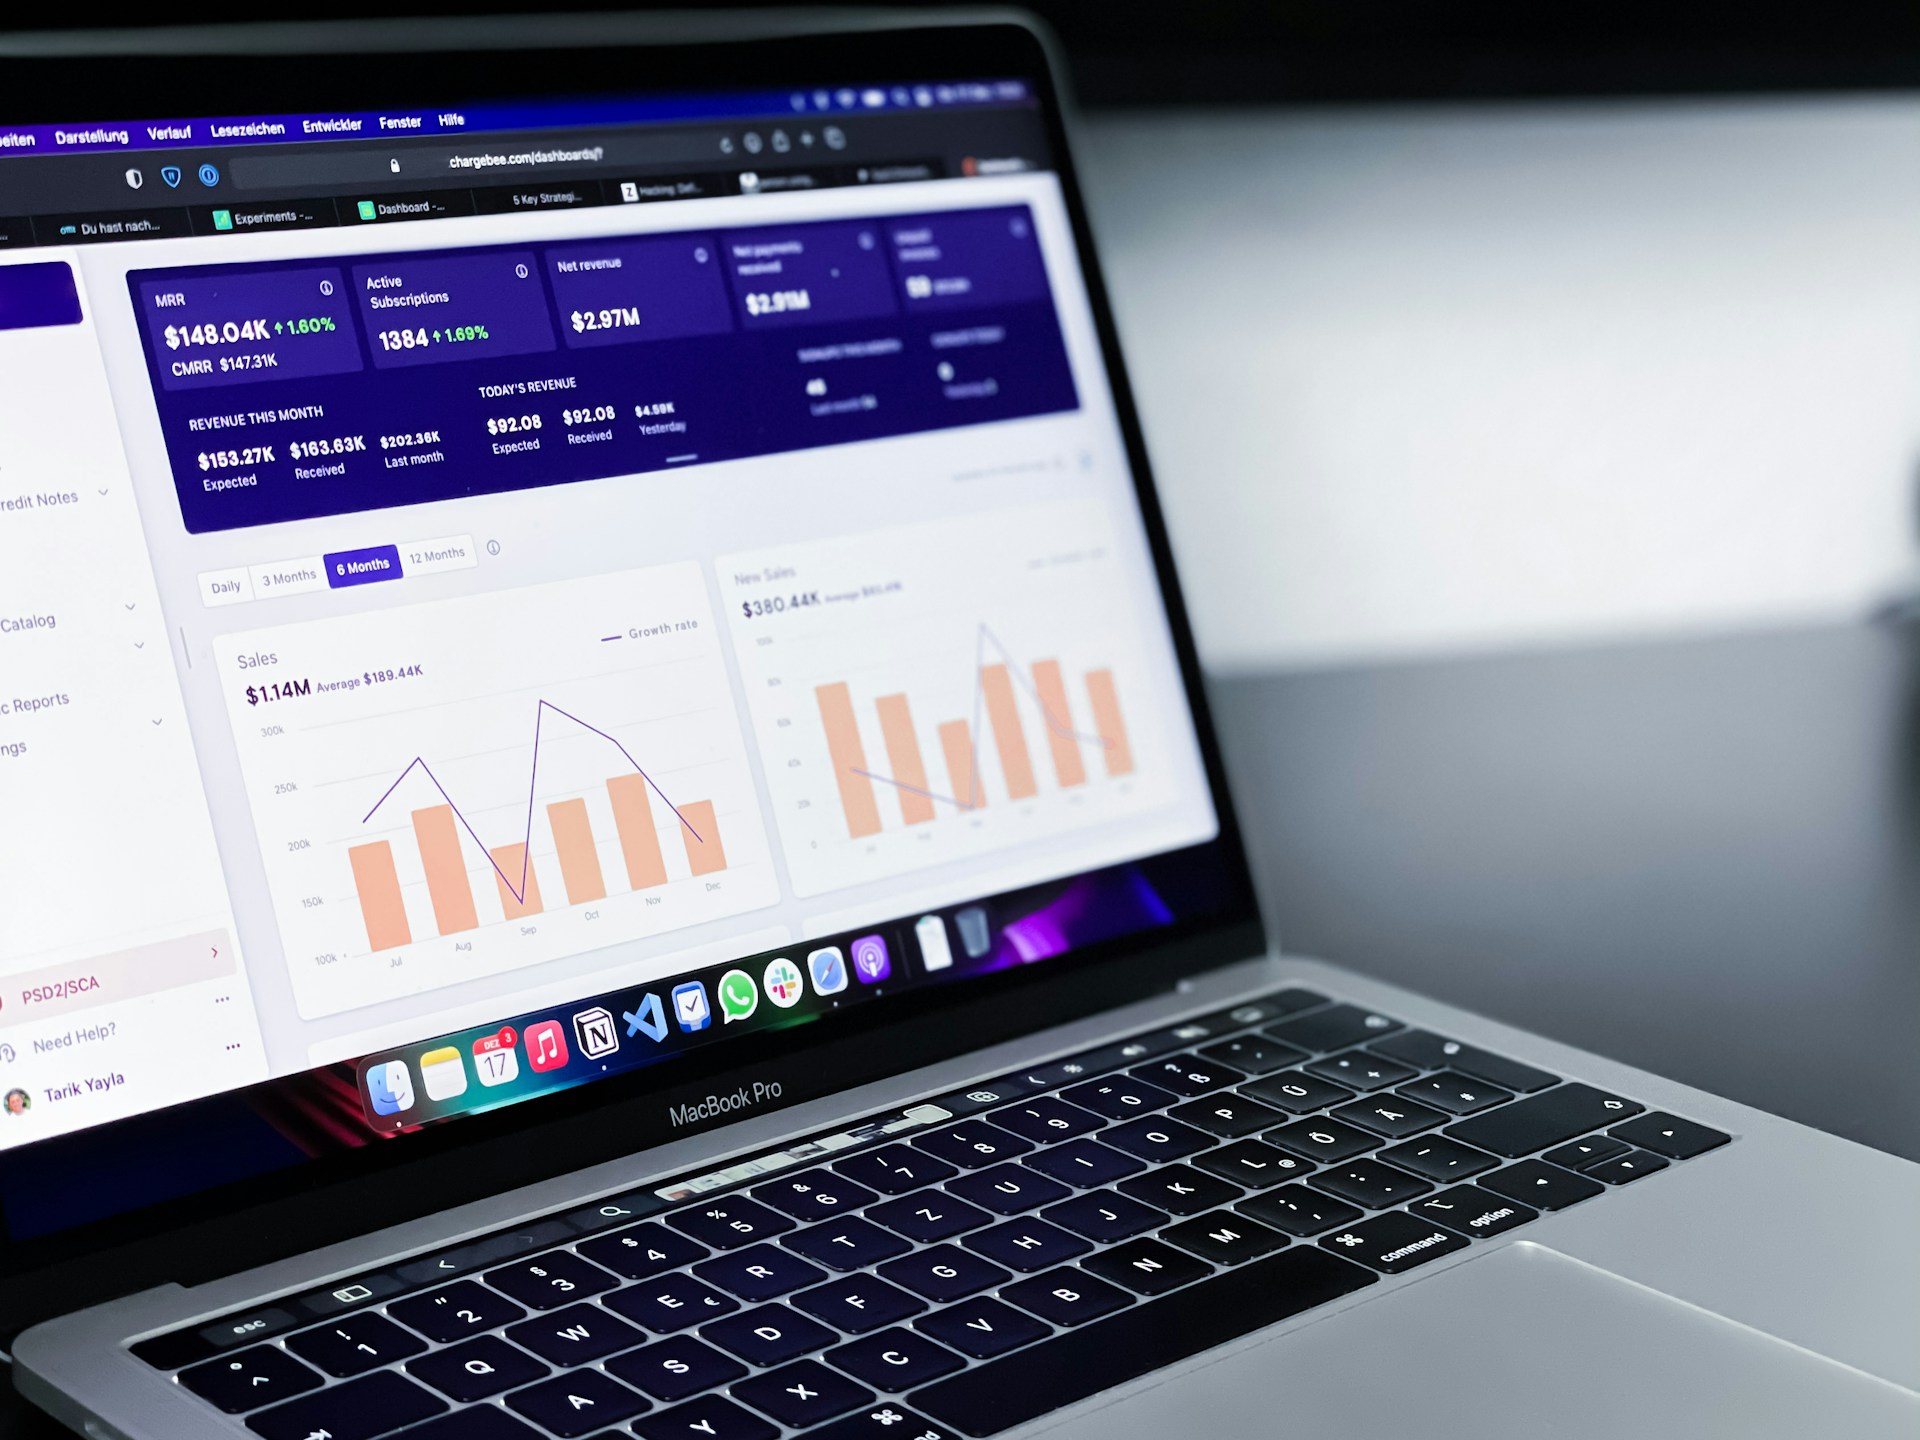
A digital dashboard displays metrics related to web performance. Graphs show detailed statistics such as total clicks, total impressions, average click-through rate (CTR), and average position over time. The chart utilizes various colors to distinguish different data sets, and the interface features tabs labeled 'QUERIES', 'PAGES', 'COUNTRIES', 'DEVICES', and 'SEARCH APPEARANCE'.
Power BI Dashboards

Create interactive Power BI dashboards that visualize your data and help you track performance effectively.

Get SQL support to optimize your database queries and ensure your data is always accessible.

SQL Support
A computer screen displaying a data analytics dashboard with graphs and charts. A blue line graph shows fluctuations in data over time, and a section highlights the number of page views. A pie chart is partially visible, indicating a breakdown of different data elements.
A digital dashboard displaying various analytics charts and graphs. There is a line graph showing user engagement over time on the left, a section with total revenue marked as $74K, and bar charts illustrating user statistics by region. The central section highlights users in the last 30 minutes, focusing on different countries such as the United States, Canada, India, Pakistan, and Brazil.

Empowering Small Businesses with Data

At PRC Analytics, we specialize in providing affordable data reporting and dashboard solutions tailored for small businesses, helping them make informed decisions with user-friendly tools like Excel, Power BI, SQL, and NetSuite.

A computer screen displaying analytics dashboards with various charts, including a line graph on the left and a cohort analysis table on the right. The table is populated with different shades of blue, indicating varying levels of user activity over several weeks. Text labels and numbers detail user retention statistics.
Your Data, Our Expertise
Transforming Insights into Action

We cater to one-person businesses, family-run shops, local services, and startups, ensuring they have the insights needed to thrive in today's competitive market with our professional data solutions.

gray computer monitor

Get in Touch

We’re here to help you with your data needs.